
How Far the Market Could Fall
The general market started the week on a down day, but two of the indices closed higher by week's end. The Nasdaq gained +54 points (+1.5%), the S&P rose +7 points (+0.45%), but the Dow fell -73 points (-0.49%). Despite the mixed results, it was a mildly positive week overall.
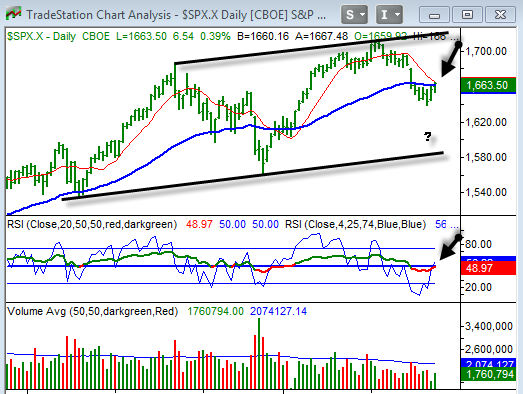
It can get a little crazy if you watch the daily movement of the market, especially during the slower summer months, so that is why I keep referencing the 50 EMA. It's a simple reference line. Price is either above the 50 EMA or below it. It keeps things simple. Friday, the S&P closed at 1,663. The 50 EMA closed at 1,661, and the 10 SMA closed at 1,664. All three are withing 3 points of one another. The market is at a point of inflection. Numbers-wise, the S&P closed above its 50 EMA today, so that may be the start of a rebound. However...
Big picture, its worth pointing out that the market appears to be a broader trading range. Lines have been drawn on the last two lows that touched the 50 EMA, as well as the last two highs. This draws out a large, range channel. Price is right in the middle of this range. Technically, if price cannot rise back up to the top line, it is likely to test back down to the lower line.