
September Could Be Worse than August
Historically, August is one of the 4 worst performing months for the S&P 500 (source: Stock Trader's Almanac). This year, the S&P's performance in August fit the history, falling -2.8% during a market correction. The large, blue arrow represents the month of August.
Now comes September, which is the "worst" performing month of the year (source: Stock Trader's Almanac). Can it get any worse? With concerns over strikes against Syria and the uncertain, unintended consequences of such an act, investors may continue to take profits and play it safe.
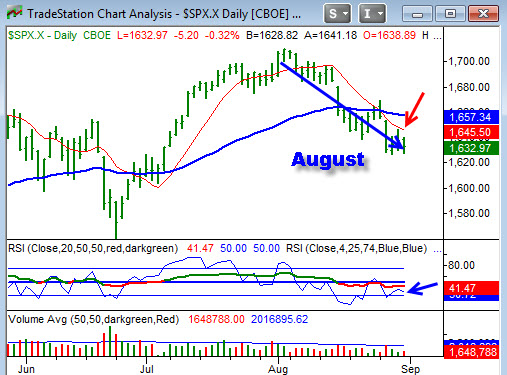
Last week had some bearish implications for September. The 10 SMA dropped clearly below the 50 EMA on the S&P 500 last week (see chart above, red arrow). This is a bearish cross, and the moving average showed no signs of turning up by the week's end. In addition, the RSI 4 (small, blue arrow) could not manage to get above the RSI 20. The RSI 4 made a lower high, suggesting the momentum is still down in the short term. The S&P has to get above 1,639 and hold before the correction can turn around.
The bigger picture is still an uptrending market on the weekly chart, probably forming a large range pattern. If so, then the correction in August should retest up towards the previous highs of August. If that happens, there will be some major short covering and some very big up days. Manage risk, be patient, stay focused.