
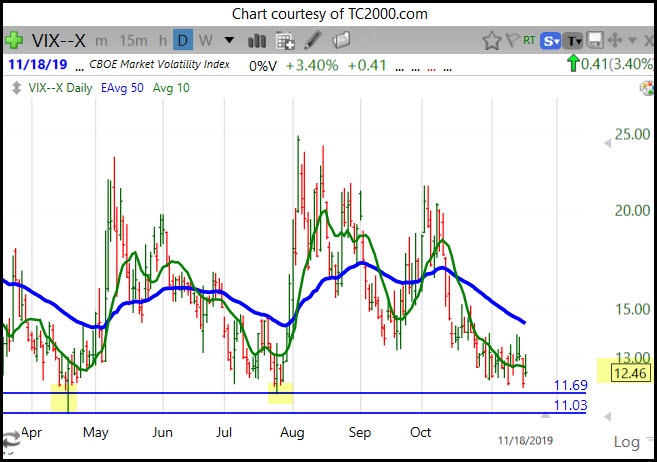
VIX Nearing Key Level
Chart Courtesy of TradeStation
The daily VIX closed at 12.46 on Monday. The price zone of 11.00 to 12.00 is where the market previously fell off its highs, at the end of July (-6%) and late September (-4%).
While the market is continuing to rise after breaking out to new all time highs, we want to keep watch and note if the VIX pivots and begins moving upward (that would be short-term bearish for the market). RSI-4 is 100 on both weekly and daily charts of the S&P 500, so a pause could be anticipated this or next week.
Also remember that retracements can go sideways, so a low VIX is not a reason to start selling. First, think of being cautious about adding more risk when the S&P is in overbought territory, and second, manage any stocks that might develop signs of weakness, either with tightening the stop, or even taking partial profits.
However, the trend trader looks to hold for the longer-term trend, if possible. Right now, the trend is still up.