
Use Relative Strength to Beat The Street
The "Relative Strength" (RS) indicator (not to be confused with the" Relative Strength Index" indicator) allows a trader to compare the performance of a stock to the performance of the general market. The indicator generally uses the S&P 500 index for comparison. The S&P 500 is a weighted stock market index composed of 500 of the largest companies in the US economy; it is used as a proxy for the general market.
Just because a stock is going up does not mean it is outperforming and becoming a real profit maker. To beat The Street, stocks in a portfolio must show stronger performance than the S&P 500. The RS indicator can tell you which stocks are the real winners.
The RS indicator can be plotted below price for comparison. This can help a trader to decide which stock to purchase, as well as which stock to cut from a portfolio. When the RS line is rising, the stock is beating the S&P; when the line is falling, it is weaker than the S&P.
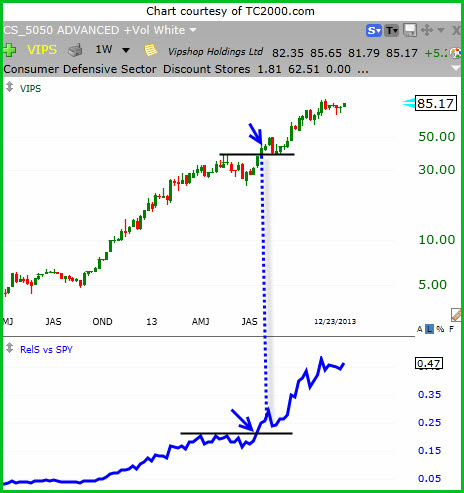
The chart above is a weekly chart of Vipshop (VIPS), one of the strongest performers in the market. The RS line is shown in the bottom window. Notice how the RS line is rising for most of the entire trend. Also, notice how the line steepened after the consolidation period in May to July of 2013; this means that VIPS wasn't just beating The Street, it was crushing it.
There is a little secret contained in the consolidation/breakout period. Notice how the RS line broke out "before" price broke out! The RS line can often give the trader a heads up on when a stock is about to breakout to the upside on strength. Most charting software also allows stocks to be ranked by RS, so this indicator can be a valuable tool for stock screening as well.