
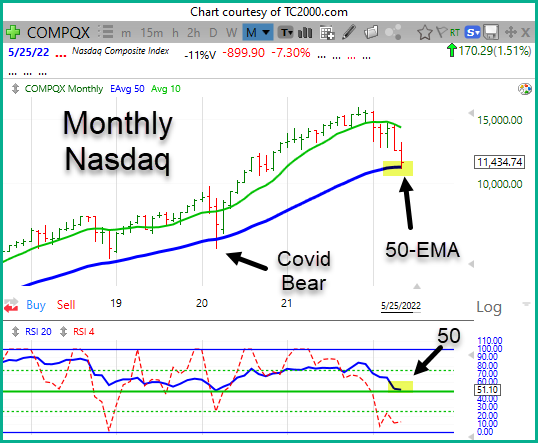
Nasdaq Near Support Objective
In the last post, the target area of 11,000 for the Nasdaq was listed as a technical support area. On 20 May, the Nasdaq set a low of 11,035, so we're getting close. The market likes round numbers, so keep an eye on 11,000.
More importantly, the Nasdaq made a full retrace to the "Monthly" 50-EMA; that hasn't occured since the bear market from the Covid crash in 2020.
Those who follow the ProTrend (50/50) Methodology know that price always retraces to the 50-EMA on some timeframe, along with RSI falling down to the 50 level. Normally, this leads to a buy signal or at least a rebound attempt.
Timing on a monthly chart takes patience, but the next two "bars" (months) will tell us a lot. Get leading signals by watching the weekly chart (or daily).
What's a leading signal? Keep it simple; watch for RSI to get back above 50. Until then, bears still have the upper paw.
The fat, furry, and fecund bear dines on inflation and rising interest rates, so don't expect him to hibernate too soon.