
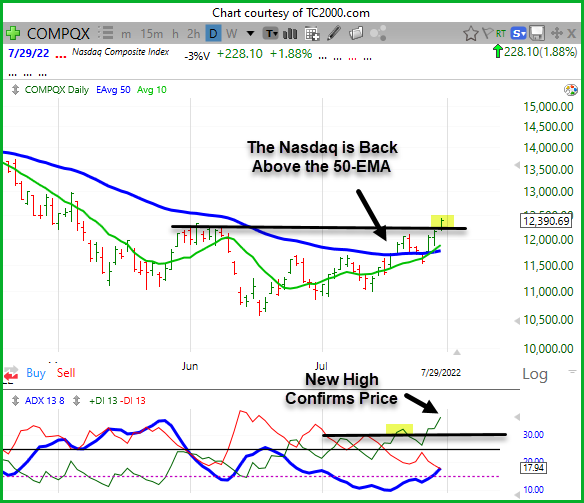
Nasdaq retakes its 50-EMA and hits new high.
Is this a Market Bottom?
Both the Nasdaq and S&P 500 set lows on 17 June and have be moving upward ever since. Is this a market bottom? Or should we be running scared because of the "recession?"
One thing to look for at market turning points is how the three major averages are acting relative to one another. Do they agree or disagree. The Dow, Nasdaq, and S&P all flashed ProTrend (50/50) buy signals last week on the daily timeframe. This agreement strengthens the potential for a market bottom.
In the daily chart of the Nasdaq (above), the index closed above the June swing high, another positive signal. The next test of resistance appears to be around 2980-3000.
ADX/DMI shows an ADXodus pattern, with a +DMI Crossover High on 21 July and upside follow through last week (new +DMI high). This is a breakout pattern, so we should antipate range exansion to continue.
What now? The daily timeframe shows a market on an upward reversal signal, the question if whether or not the weekly timeframe will follow. For now, trades from the long side are working again, but the market still has more to prove.
You may be keying on terms like recession and stagflation, but I like two other terms: Price and Volume. They will tell us what we need to know going forward. (Note: We appear to be at a potential short-term resistance area, so we my pullback this coming week).