
Market Breaks to New Highs on Strength
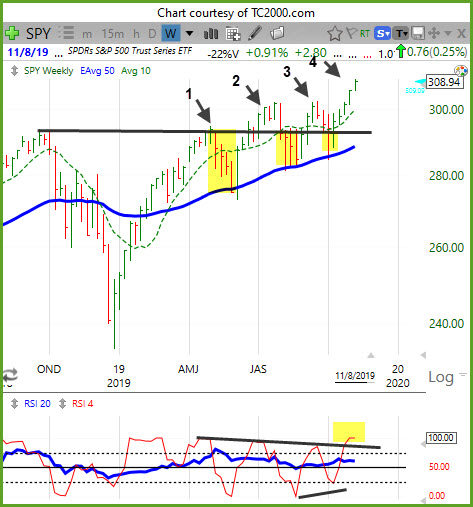
The SPY (S&P 500 ETF) hit an all-time high in September 2018, then it plunged to a climax low in December. The rebound brought the SPY back up to retest the 2018 high (horizontal line) in May 2019 (arrow 1), but price quickly fell below the hold high (yellow highlight).
It pushed through again in July (arrow 2) but again fell back below the line (yellow highlight). The SPY made a third breakout attempt (arrow 3) in September but fell back below (yellow highlight). Note how the yellow highlighted areas got progressively smaller.
The current November breakout (arrow 4) is underway, and it is stronger. Note the higher low of RSI-4 (red line), momentum convergence, prior to making a higher high (stronger momentum) on the breakout. In addition, the current breakout broke above the highs of all 3 prior breakout attempts.
This breakout looks like it will continue.