
Can the Nasdaq go Lower? Take a Look.
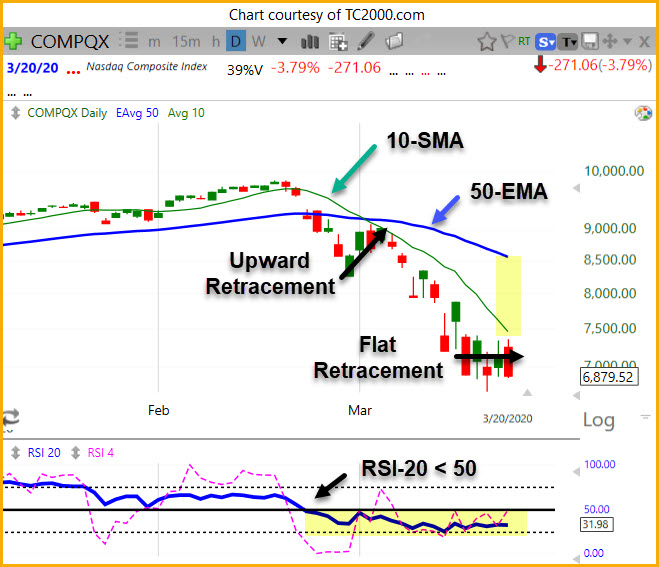
The Daily Nasdaq chart shows the 10-SMA and the 50-EMA, our standard moving averages. The 10-SMA crossed under the 50-EMA in late February. Moving averages are lagging indictors, but you can see that the distance between the 10 and 50 averages is still widening (yellow highlight).
The Nasdaq made an upward retracement to the 10-SMA in early March. Currently, it appears that the retracement to the 10-SMA is "flat," forming a bear flag pattern. This suggests that investors are not yet buying on dips, and/or shorts are mostly holding for further downside. In flat retracements, price generally waits for the 10-SMA to "catch up" before testing downward on another swing.
Also, note how RSI-20 fell below 50 (into the weak zone) in late February (25th) and has remained below 50. The correction cannot end (ProTrend Rules) until RSI-20 is back above 50 (in the strong zone), so that is something to watch going forward.
In December 2019, the Nasdaq hit a low of 6190, so that is the next "big" target to the downside.
The technical analysis during this pandemic, new-driven market should be read with some caution, since a new drug treatment or vaccine could cause a strong rally; also, congress is working on an economic stimulus package. In contrast, rising deaths and long business shutdowns are likely to continue weighing on the market.