
ProTrend Charting Indicators
If you're serious about trading, you need high-quality charting software that gives you the tools to prosper. Charts are your main tool for success; they help you efficiently organize information, interpret price action, and find quality stock setups.
The ProTrend Methodology used the 50/50 Strategy approach (there are 4 main trend-trading strategies). The 50/50 is simple, straightforward, and easy to learn. It works across all timeframes and trading instruments (stocks, futures, forex). The strategy is built around specific indicators and settings.
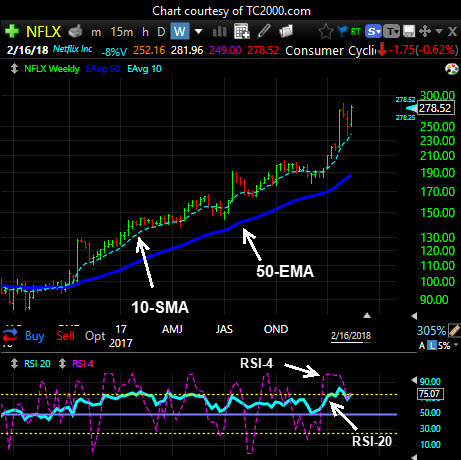
Many charting programs have pre-loaded, default indicators that can't be adjusted. Adjustable indicators are a must for the serious trader or investor. These are my chart indicators (see chart):
- 50-period exponential moving average (50-EMA)
- 10-period simple moving average (10-SMA)
- 20-period Relative Strength Index (RSI-20)
- 4-period Relative Strength Index (RSI-4)
The 50-EMA represents the "main trend" on a chart.
The 10-SMA provides a gauge of short-term momentum. It helps in timing the stock purchase and for risk management. In very strong trends, the 10-SMA will remain above the 50-EMA for extended periods of time. Note how the 10-SMA has been above the 50-EMA for over a year on the weekly chart (above).
The RSI-20 provides essential information about a trend's power and momentum. When RSI-20 is above the 50 level, the stock has enough strength to trend upward. Crosses above the midline (50 level) from below are one of the two essential criteria for the 50/50 Strategy.
The RSI-4 helps with short-term timing.
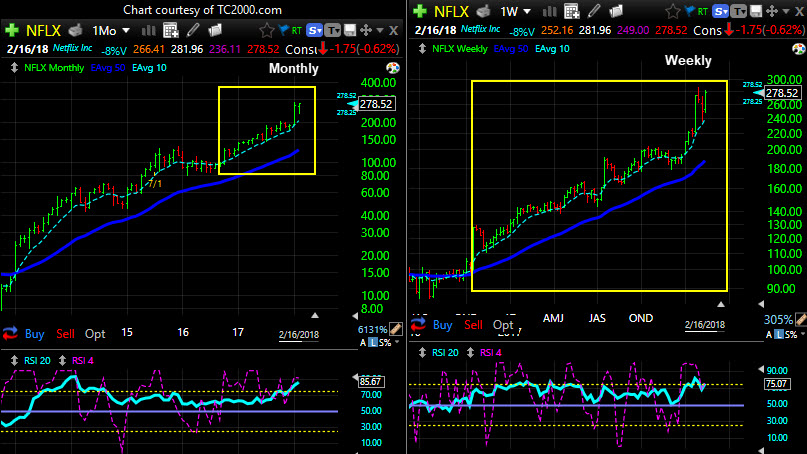
For charting software, I use TC2000. It allows me to look at two timeframes side-by-side, either the monthly/weekly for longer-term investments, or the weekly/daily for swing or momentum trading. If day trading, I might use an hourly chart in combinatioin with a 5-minute chart.
https://www.tc2000.com/?affCode=cctraderllc">Learn More About TC2000.com Charts
Above, the monthly and weekly charts are seen side-by-side. The yellow box on the monthly chart contains price action that is represented by the yellow box on the weekly chart. Notice how the monthly chart is like zooming way out to see the big picture.