
HOW TO TRADE AN IPO
Could You Trade This Chart?
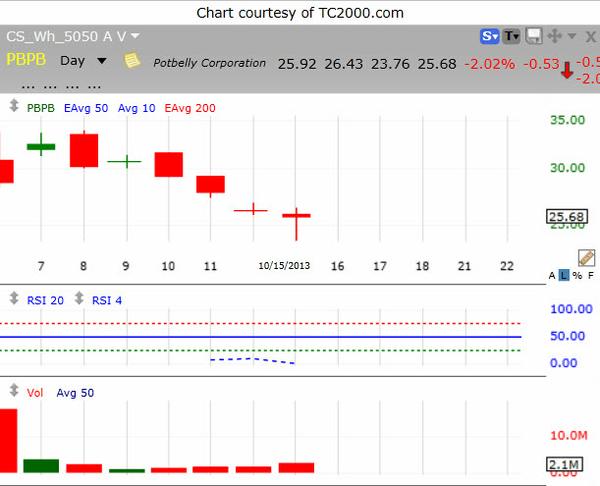
The recent IPO (initial public offering) of Potbelly Corp (PBPB) occured on October 4, 2013, when the stock opened at a price of $28 and climbed to $38 (+35%) on the same day. That's a pretty nice gain for one day! However, in the next 7 days, the stock fell to a low of $23, a 40% decline.
Trying to make trading decisions on the chart of an IPO can be challenging. The chart (above) of PBPB only shows 8 price bars. The 10 SMA, 50 EMA, and 200 EMA do not show up on the chart because there is not enough price data to construct the moving averages. Likewise, the middle window with RSI 4 and RSI 20 only shows a short RSI 4 line.
The one benefit in this chart is the daily volume. While there is no 50-day moving average of volume (lack of price data), the individual volume bars can be correlated to the few price bars present. On day 1 of the IPO, the volume was down. The next day was an up volume day, but it was weaker than the red volume bar; therefore, the stock was not being bought up with strength. The rest of the volumes bars are dominated by down days. At some point, the IPO will establish its bottom price level (support).
With an IPO, you must rely on price and volume bars alone. One can still see that the last volume bar (down) was stronger than the prior 5 volume bars, and price closed in the upper 50% of the day's range. This is actually a bullish signal. If price forms a pivot low at this level, it may begin a new upswing, a swing which could test the old high of $38 and maybe begin a new uptrend.