Use Daily Charts for High Flyers
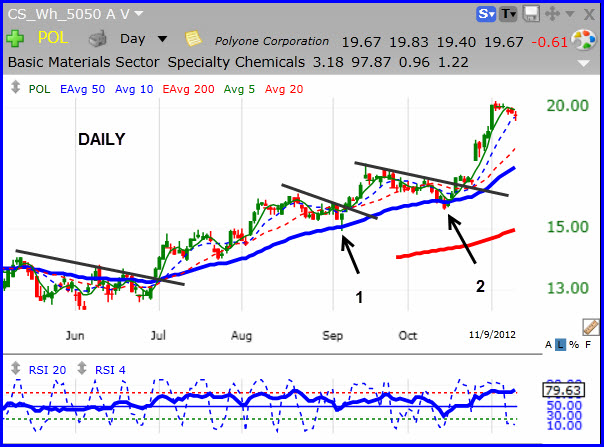
For longer term investors, it is generally best to use weekly charts when trying to build a winning portfolio of stocks. The 50/50 strategy is a great method for entering stocks that trigger a buy alert near the "weekly" 50 exponential moving average (50 EMA). Usually, if an investor misses the initial trend breakout, he/she can look for the next 50/50 signal at a subsequent pullback to the weekly 50 EMA. However, some strongly trending, "high flyer" stocks may not pullback to the weekly 50 EMA for a period of up to a year, or more.
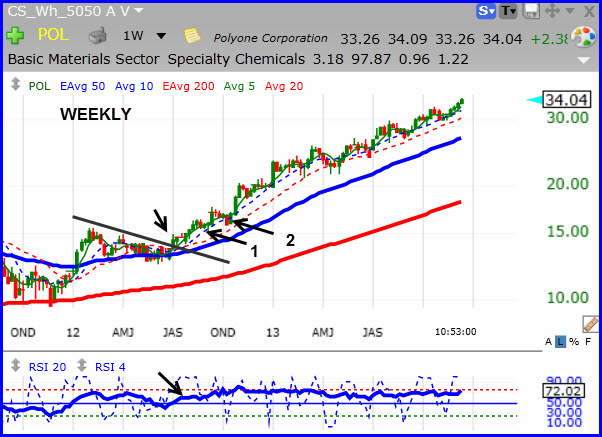
In the chart of Polyone Corporation (POL), notice how the the stock broke out of a consolidation pattern in July of 2012, but it has not pulled back to its weekly 50 EMA in over a year. An investor waiting for a weekly 50/50 pullback would have missed a significant profit opportunity.