
Watch Volume After the Breakout
We hear over and over that we should look for strong volume on breakouts, but the volume picture "after" the breakout is just as important. Some breakouts will fail even when they are accompanied by high volume. Breakouts are easy to see, and we may buy them with a false sense of security. The BIGs use false breakouts to unload shares of stock on the small investor, so studying volume can be a big help in avoiding losses.
After a breakout, a stock often takes a few, or several, days to rest. This is the time when a trade can be at risk. By watching volume after the breakout, the investor can find clues about the strength of the move and whether it is likely to continue up.
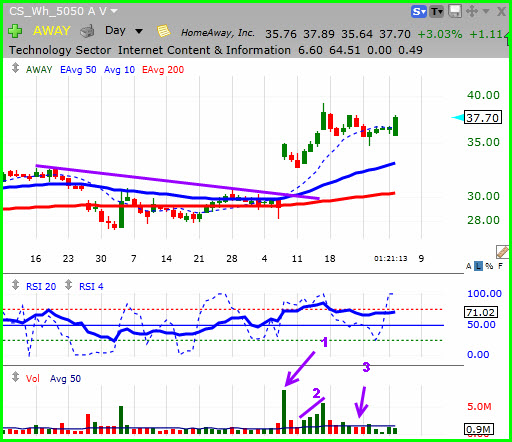
In the daily chart of AWAY (above), there was a breakout above a descending resistance line (purple) on a 50/50 Low Riser setup. Note the very high (6X) volume bar (1) associated with the gap up day on 7 November. After the gap up, there were 2 days of weaker down volume, followed by increasingly stronger up volume (2).
The stronger up volume was a signal that the breakout was being supported by the BIGs. Also, note that the next two down volume bars (3) were weaker than the up volume at (2).
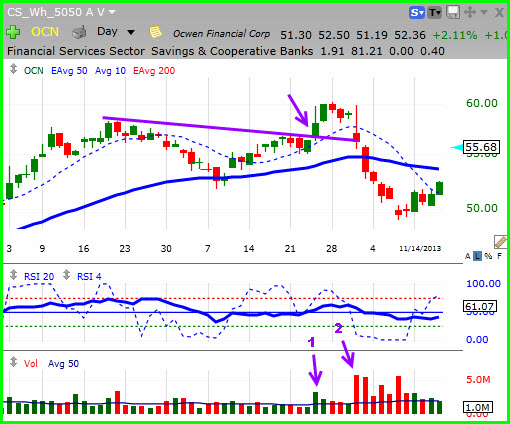
In contrast, OCN is an example of a stock that did not have supportive volume after the breakout. This High Riser stock broke above the descending resistance line on high volume (1), but then higher "down" volume came into play (2). This meant the BIGs were selling out when the stock made a the new high.