
3 Keys to Reading this Market
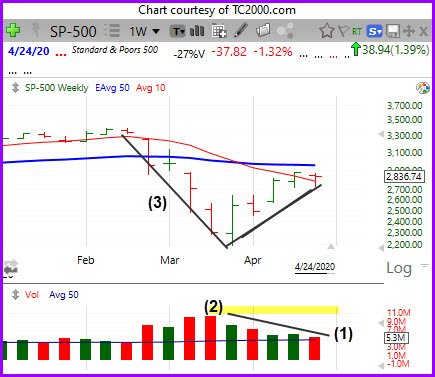
The WEEKLY S&P shows the relationship between price and volume during the index's rise off the 23 March low. While price advanced over the last 4-5 weeks, weekly volume has declined (1). In addition, the highest "up" volume during the advance is less than the highest "down" volume of the preceding decline (2). If price is halted below the weekly 50-EMA (and this is a swing high), then the upswing is shorter than the preceding downswing (3), so upward momentum has been relatively weaker (to this point, if it's a swing high). Despite these 3 factors, the market is still rising with the buyers dominant, suggesting more upside before a potential pullback.
Follow Up on 29 April
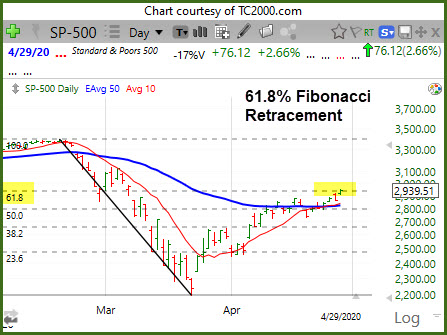
The S&P has now advanced to the 61.8% Fibonacci retracement level of the March decline, quite an accomplishment given the magnitude of the market's tumble due to coronavirus and the current level of unemployment. This is a area where the market may find resistance and begin a pullback.