
Basic Chart Reading
Every investor should know at least the bascis of chart reading if they plan to risk any money in the stock market. And there's one important principle to know that will largely determine your success.
Now, let's get started with the basics. NOTE: In order to help those relatively new to trading, we try to present material from the perspective of a beginner.
The Price Bar
A price bar is a visual representation of all the prices at which a stock traded during a specified period of time. For example, daily price bar would include all the trading prices for a stock during a day's session at the New York Stock Exchange.
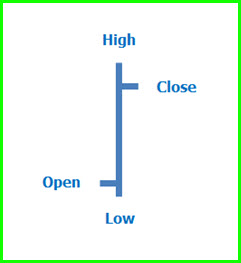
Each bar has four key price points:
1) Open: The first price where a stock traded during the period.
2) High: The highest price during the period.
3) Low: The lowest price during the period.
4) Close: The last price where a stock traded during the period.
Note: This applies to all trading vehicles (stocks, futures, forex, commodities, ETFs, Mutual Funds)
These four points can be seen with an OHLC (Open-High-Low-Close) Price Bar, as seen below.
Price bars are the building blocks of trend, and the patterns they form on a chart will provide key insights into the direction of price. Below is a chart of Boeing (BA) showing OHLC price bars:
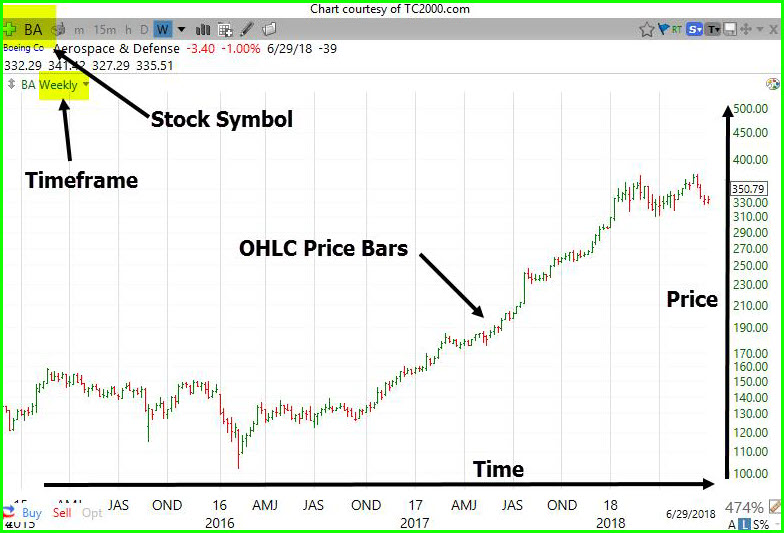
This basic chart (courtesy of TC2000.com) shows OHLC bars. Prices are listed at the right margin, time along the bottom. Charts will also indicate the stock symbol and bar period (daily, weekly, etc.), which is also referred to as the chart's timeframe.
Bar Period
The Bar Period is the time represented by each price bar, such as hours or days.
Common bar periods are are monthly, weekly, and daily for investors; traders may also use intraday timeframes (60-minute (hourly), 5-minute, etc.).
This next part can be confusing if you're new to all of this, so take time to think about it.
The daily bar includes price action during a normal market session that begins at 9:30 a.m. ET and ends at 4:00 p.m. ET.
A weekly bar includes prices during a normal (no holidays) trading week (5 days, Mon-Fri). The week begins at 9:30 a.m. on Monday and ends at 4:00 pm on Friday. One weekly bar represents the price action of five daily bars. Okay so far?
A normal monthly bar has all of the price action during any given month, from 9:30 am ET on the first day of the month, ending at 4:00 p.m. ET on the last day of the month. The monthly bar will represent the price action of 4-weekly bars since there are 4 weeks in a month. A monthly bar also represents 20-24 daily bars since there are about 20 trading days in a 31-day calendar month.
Pro Tip: Much of the media refer only to daily charts when reporting stock news. The savvy investor knows they must look at weekly, or even monthly, charts in order to see the big picture.
Look how much different things look between the monthly view and the daily view of the same stock.
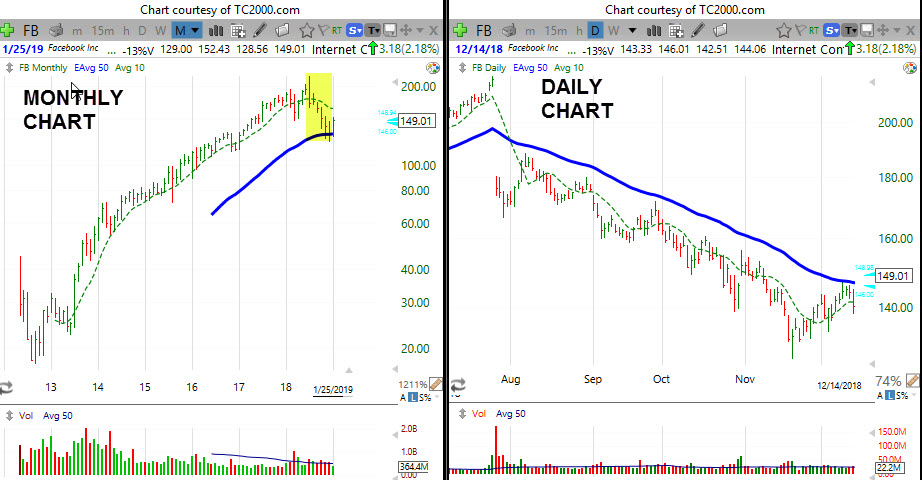
Above we see the monthly timeframe on the left, compared to the daily timeframe on the right. Notice how the daily chart "looks" pretty bad; the stock has been tanking since it gapped down in August. But when you look at the monthly chart (left), the decline is not that much in comparison to its long rise.